The Imago Mundi
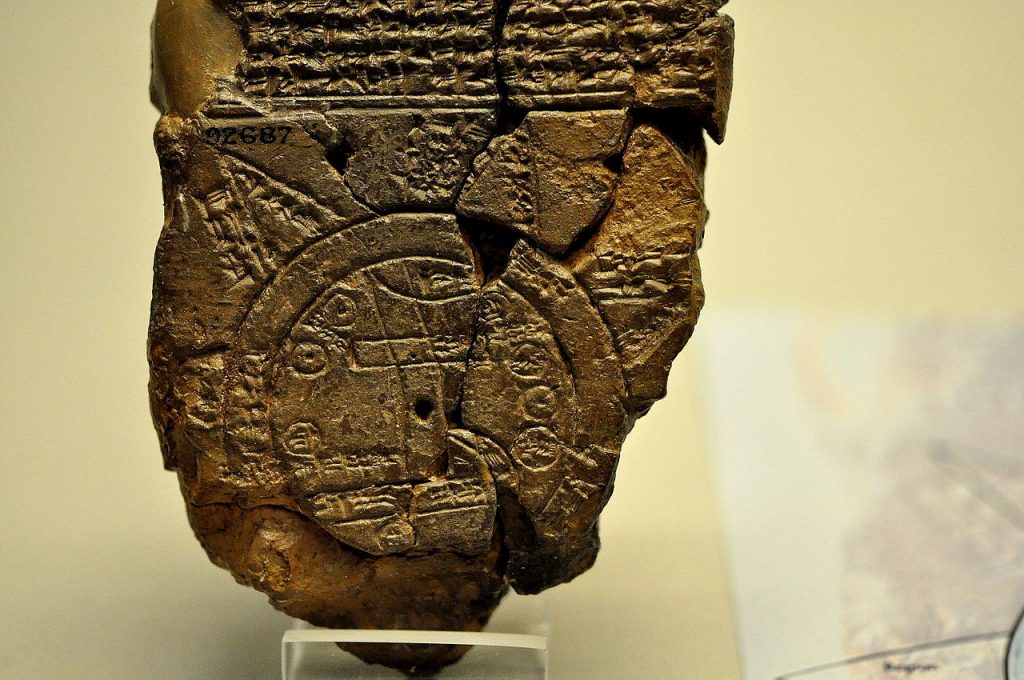
The Babylonian World Map, also known as the Imago Mundi, is one of the oldest known representations of our world. This ancient map offers a fascinating glimpse into the geographical knowledge and worldview of the Babylonians over two and a half millennia ago as well as their expertise as craftsmen. In this article, we will look at the discovery of the map, its creation, materials, authorship, similar maps, what it depicts, its accuracies and inaccuracies, its impact and legacy, and its current location. Discovery and Background The Map was discovered during archaeological excavations in the ruins of the city of Sippar in the late 19th century. Sippar was one of the oldest cities in Mesopotamia with origins dating back as far as 2900 BC. It was found on the eastern banks of the Euphrates close to Baghdad in modern day Iraq. Sippar was a significant urban center with a population of up to 40,000 inhabitants, comparable in size with other cities such as Ur and Uruk. It was known for its temple dedicated to the sun god Shamash. Given its location on the Euphrates, it was also an important trading outpost. By MapMaster – Own work, CC BY-SA 4.0, https://commons.wikimedia.org/w/index.php?curid=3578442 Creation and Materials The exact date of the map’s creation is not well-documented, but it has been estimated at no earlier than the 9th century BC. It was part of a series of finds that provided substantial insights into ancient Mesopotamian civilization. The map was created during the Neo-Babylonian period. It is inscribed on a clay tablet using the now extinct Cuneiform Akkadian language, a writing system developed in the city of Akkad, and used across Mesopotamian. The tablet measures approximately 12.2 cm by 8.2 cm, with a generally better preserved upper half, the lower extremities having been lost. The clay tablet was likely produced by a Babylonian scribe. Although the identity of the scribe remains unknown, there are some clues in the text contained on the front of the tablet. This map is part of a larger tradition of Mesopotamian cartography and geographical texts, reflecting the intellectual and scholarly pursuits of the time. The use of clay tablets was common in Mesopotamia due to the abundance of clay in the region and the durability of baked tablets. What does the map actually depict? By Osama Shukir Muhammed Amin FRCP(Glasg) – Own work, CC BY-SA 4.0, https://commons.wikimedia.org/w/index.php?curid=42131230 The map is divided into three sections. On the front, the pictorial representation, the map itself, is found on the lower two thirds of the front of the tablet. The upper third is text. On the rear of the tablet is also text. The structure and information of each section differs greatly, implying that the three sections may have been compiled from three different and possibly unrelated original sources. The first thing to notice of the map section are the two circles that cover more than half of the map portion. They are labeled ‘Maratum’ which literally translates as ‘Bitter River’. It is thought that this represents the Persian Gulf. The label refers to the salt sea. The Persian gulf was over 500km from Sippar. Inside the circles, there are 7 additional smaller circles, which are thought to represent 7 cities, with Babylon being represented in the center at the top. The parallel lines at the bottom of the map represent marshland, which could be the current day Iraq Central marshes, Hammar marshes or Hawizeh marshes. A line in the north east corner of the map appears to be the modern day Zargos Mountain range, which runs from south east Turkey, down the eastern border of Iraq and onwards into western Iran as far south as the strait of Hormuz. All of the labeling and annotation on the inside of the circles is in Cuneiform. Seven or eight triangular sections outside the water circle represent named “regions” (nagu). The descriptions for five of them have survived. The map indicates features spread across much of eastern Iraq, an area of many hundreds of thousands of square kilometers. The text above the map describes the creation of the land and sea by Marduk, the patron saint of Babylon. It is written that he parted the primeval ocean, called Tiamat, thus raising dry land. The next few lines refer to at least 15 animals, the Mountain Goat, Gazelle, Lion, Wolf, Monkey (and female Monkey), Ostrich, Cat and Chameleon. Other than the Cat, none of the animals listed were to be found in ancient mesopotamia. The last two lines of the text refer to three legendary heroes: Utnapištim (the hero of the Flood), Sargon (ruler of Akkad), and Nur-Dagan the King of Buršaḫanda (opponent of Sargon). The back side contains at least 29 lines of text and seems to be a description of the nagu, or regions of ancient Mesopotamia. It is assumed that the nagu listed on the rear are the same nagu as depicted on the front. After an introduction, possibly explaining how to identify the first nagu, the pattern for the remaining descriptions is to list the nagu by number, and state the distance in leagues that one must travel to get there from the previous nagu. The distances listed on the rear do not seem to correspond to any scale depicted on the front. This could be because such scale drawings were not helpful when journeys were measured in days or weeks. It could more simply be that the rear of the tablet is referring to a different set of nagu than those represented on the front of the map. A short description is given for each of the eight nagu, but those of the first, second, and sixth are too damaged to read. The fifth nagu has the longest description, but this too is damaged and partially unreadable. There are some rather strange pieces of information that the author though to include, such as: ‘The third nagu may be a barren desert, impassable even for birds: A winged bird cannot safely